Jmeter Tutorial: Learn about the tool in a jiffy!

Jmeter Tutorial blog by us will help you in learning about the famous tool and what’s it is used for.  Usually, Apache JMeter is used for performance testing. Performance testing is one of the important testings to be performed on AUT. It will let you know the load which your application can handle and what happens if that load exceeds prescribed limits.
Through, meter tutorial let us know more about JMeter and see how it can be used for performance testing. 

About JMeter – Jmeter tutorial introduction
JMeter is an open-source software which is designed by Apache Foundation. It is used to apply load to AUT to know its performance. With the help of JMeter, you will be able to apply a heavy load to the application with concurrent or multiple traffic to emulate real-time user behavior.
For applications such as Amazon who release flash day sales, it is very important to do performance testing. On a single day and in a time interval of 5 mins many customers hit the site and we must make sure that the application behaves expectedly without any flaws. One more application where performance testing is very important is the railway ticket booking website where a large chunk of people hit the server at the same time. In these cases, it becomes very necessary to test out the website under heavy load. 
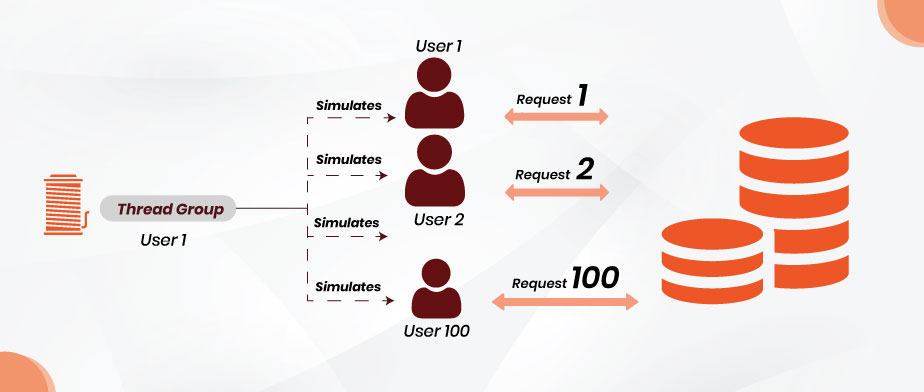
JMeter is usually used for testing of web or FTP application. With JMeter, you will able to identify how many concurrent users a server can handle. Thinking of hitting Amazon with 1000 concurrent users. For achieving the scenario, you cannot purchase 1000 machines to achieve the behavior. JMeter allows you to hit the Amazons server with 1000 requests concurrently. JMeter simulated real-time user’s behavior intelligently. JMeter sends requests to the target server and then retrieves the statistical information of the server. With this information, it generates test reports in different formats. 
Some benefits which you gain via JMeter is a User-friendly GUI, Graphical Test Results, easy installation, and platform independence. It has an amazing record and playback feature which makes it very easy to learn even for the novice. Also, its script test can be integrated with Selenium tests and beach shells for more robust automated testing. Through the Jmeter tutorial, we are trying to et up a tutorial for people to learn about this magnificent tool.

Step-by-step  Jmeter tutorial

How to Download and Install Apache JMeter
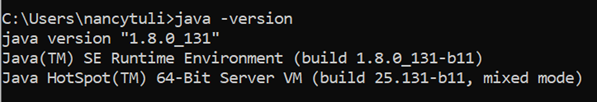
JMeter is a java application and it needs Java in the machine so that it can run seamlessly. JMeter can be installed in Windows, Linux, Ubuntu, and Mac operating systems. Before installing JMeter, make sure that you have Java installed in your machine. You can check by hitting the command in your terminal. java -version
If java version is highlighted then java is installed in your system and if nothing appears then install Java by clicking here
How to Download and Install Apache JMeter

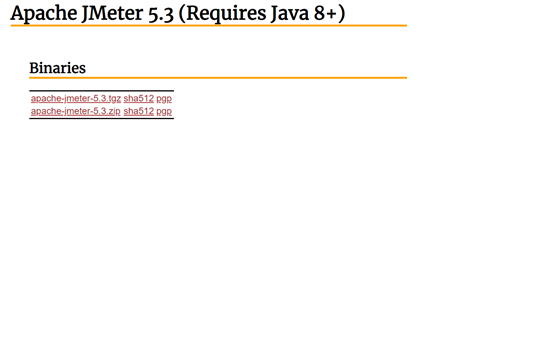
  1. Now it is the time to download JMeter. Download the latest version by clicking here. Download the binary file shown below. 

download JMeter
2. The installation of JMeter is very easy. The download binary file must be unzipped into the folder where you want to download JMeter. The unzipped folder would like just as below snapshot.

3. Run JMeter in GUI mode by clicking on the bin folder and then jmeter.bat file. 

4. After clicking, JMeter will open just as below. 
How to Download and Install Apache JMeter
More on Thread Group, Samplers, Listeners and Configuration of JMeter

  • Thread Group is basically the application of multiple threads to AUT. Each thread represents one user who is accessing the application. With the help of the thread group, you can apply a number of threads which is defined by you. 

More on Thread Group, Samplers, Listeners and Configuration of JMeter

  • Samplers allow JMeter to support testing of different protocols such as HTTP, FTP, JDBC, and others. 

  • FTP Request: If you want to do performance testing for the FTP server then you can use the config element of the FTP request. You can send a download a file or upload a file request to the FTP server. You need to add parameters to the sampler such as server name, remote file name (to be downloaded or uploaded), port number, username, and password. 


  • HTTP request

With this help of the HTTP request sampler, you can request an HTTP request to the server. With the help of this request, you can retrieve HTML files and images from the server. 
HTTP request

  • JDBC request

With this help of a JDBC request sampler, you can perform database performance testing. You will be able to send a JDBC request to the server. You should be able to add the SQL query in the query tag. 
JDBC request

  • SMTP Server

If you want to test the mail server then you must use the SMTP server sampler. With this protocol, we can send emails. 

  • CSV Data set Config

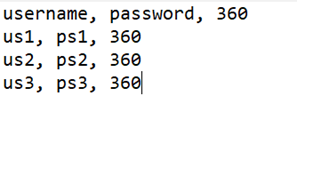
If you want to test the website with different users who are having different credentials, you must take the help of CSV data set the config to pass the credentials. You can store the credentials in the text file. It will read lines from the file using a delimiter. 
You must pass the data in a text file the same as the below snapshot.

  • HTTP Cookie Manager

When you log in to some website then your browser stores cookie so that you do not have to login again and again. Similarly, an HTTP cookie manager also does the same task for you. If the website is returning cookie in response, then it will save a cookie for you to maintain a session.  You can add an HTTP cookie manager in your test plan with the help of the config element. When you will record sessions using Blaze meter, it will automatically record cookies in the HTTP cookie manager. 
HTTP Cookie Manager

  • Listeners

Listeners listen to the results fetched by the JMeter and let you analyze the results with the help of visual reports. 
Listeners

  • View Results Tree: You get to see all the user requests in HTML format using view results listener. 
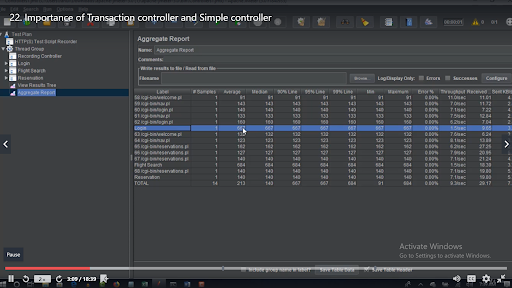
  • Aggregate Reports

With the help of aggregate reports, you can get total samples, average, median, minimum, maximum, and throughput. 

  • Jmeter Timers

Once you start sending requests to your AUT, you should have timers between each request so that it can simulate real-time behavior and the server does not get confused with so many requests hitting the server. Let us see the different kinds of timers which we can integrate to simulate real-time behavior

  • Constant Timer


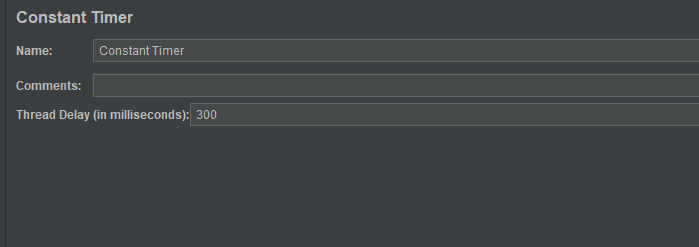
It delays each request by the same amount of time. 

  • Gaussian Random Timer

Gaussian Random Timer
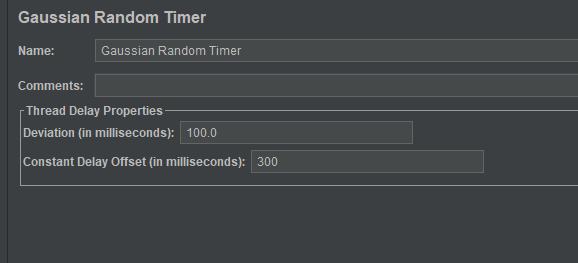
It delays each request by any random amount of time. You can define the deviation around which the delays would be adjusted. Also, offset can be added with the gaussian distribution of deviation value and then the total delay time can be calculated. 

How to do load testing with Apache Jmeter? Click here

  • Uniform Random Timer

Uniform Random Timer
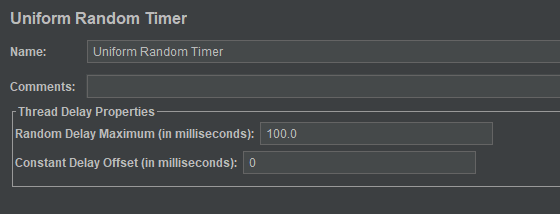
It also delays each request by a random amount of time. You can define the random delay maximum time and the offset value which will be added to the random value. 

  • Bean shell, BSF and JSR223 timers

Bean shell timers introduce a delay time between each request using bean shell scripting. BSF timer is used to add a delay time between each request using BSF scripting language. Similarly, JSR223 adds a time delay using the JSR223 scripting language. 
The most used timers are constant and gaussian timers. 
Assertions in JMeter
Assertions are very useful in any kind of testing as verification and validation are the heart of testing. You must compare the results with the expected results to know if we are getting the correct response or not. Let us have a look at the most common types of assertions. 

  • Response assertion

It allows you to check the response against pattern strings. Take an example of Amazon.com. If you hit the server with some product then the response list should contain the product mentioned in the search list given in the request payload. 
You can choose text response and add the test which you want to validate. I have added the text in patterns to test. 
Response assertion
Also, we can validate the status code with the response assertion Select the field to test as response code and mention the code in the patterns to test. 

  • Duration Assertion

Duration Assertion
It tests that the server’s response is received time limits. If it is taking more than the time mentioned, then the assertion will be failed. 

  • Size Assertion

Size Assertion
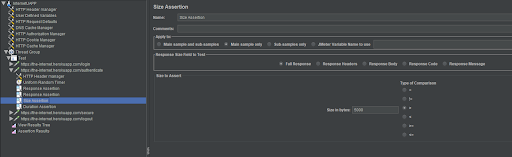
It checks the response has the expected number of bytes contained in it. If it is above the defined limit, then assertion will be failed. In the below snapshot, if the response has equal or less than 5000 bytes then the assertion will be passed. 

  • XML and HTML Assertion

XML assertion verifies that the response data has correct XML syntax while HTML assertion verifies that the HTML syntax of response is correct. 
Controllers in JMeter
Controllers are used in JMeter to handle requests in an organized manner. There are different kinds of controllers that can be integrated with the JMeter Test Plan. These controllers let you handle the order of requests to be sent to the server. Let us have a look at different kinds of controllers. 

  • Recording Controller

Recording Controller
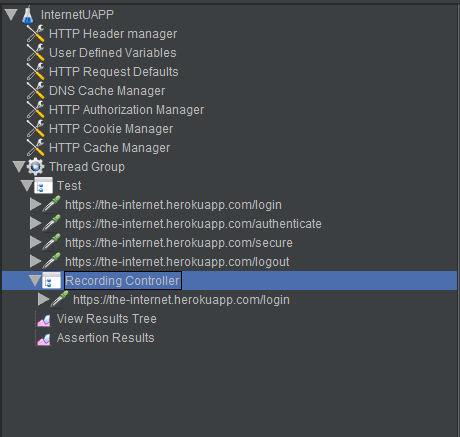
JMeter will record your testing steps but for storing them in a container you require a recording controller. 

  • Simple Controller


Simpler Controller is just a container to store your requests. You can give a meaningful name to the controller. In this way, if you want to duplicate the requests, you can simply add the simple controller without again and again adding so many requests. It is just for clubbing requests and in the view, results graph you will not see any controller name. 

  • Loop Controller

It allows the requests to run a specified number of times or forever if the number has not been defined. 

  • Transaction Controller


The transaction controller is similar to the simple controller which records the overall time for the requests to finish. It has an additional benefit over simple controller as you will be able to see the controller name which has the clubbed requests instead of individual requests name in view results graph. 

  • Module Controller

Module Controller
It is based on the idea of modularity which says that a set of requests can be clubbed in a simple or transaction controller. A module controller can be used to add any set of requests by selecting the controller. Suppose if you have 3 simple controllers named login, search and logout, then with the module container you will be able to select which you want to simulate again so that you don’t have to add the same requests again and again. 

  • Interleave Controller


This controller pickups one sampler per iteration and it is executed from top to bottom. In the below snapshot, we are having one interleave controller having 3 samplers names News Page and FAQ Page and Gump Page. It is running with 2 threads and a loop count of 5. So, a total of 10 requests will be executed per thread. 
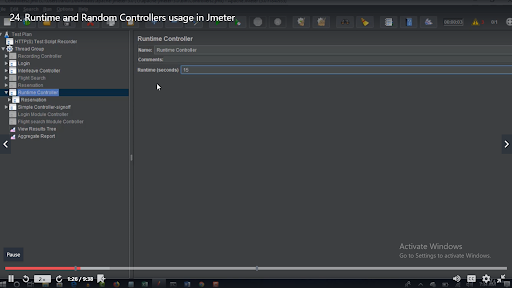
  • Runtime Controller

This controller controls the execution of its samplers for the given time. If you specify the run time as 10 seconds, then JMeter will run your tests for 10 seconds. 
Runtime Controller

  • Random Controller

It is the same as the Interleave controller but instead of running from top to bottom, the random controller picks any requests randomly. 
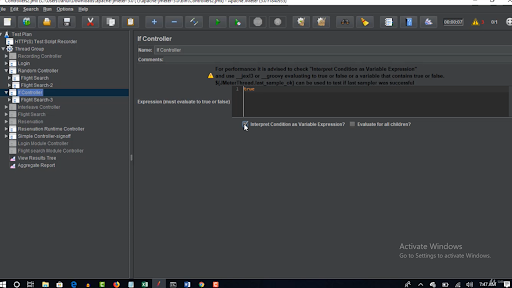
  • If Controller

It runs the requests only when a set of conditions is fulfilled. 
Apache Jmeter tutorial 7
Processor in JMeter
Processors are used for modifying the samplers. There are two types of processors. 

  • Pre-processor are the processors which are applied before sampler requests. If you want JMeter to check all the links on the page and then retrieve the HTML. You can add HTML link parser which will parse links before a request is made to the server. 
  • Post-Processor: If the request is made to the server and is the requests send you an error then the post-processor should stop the further execution. 


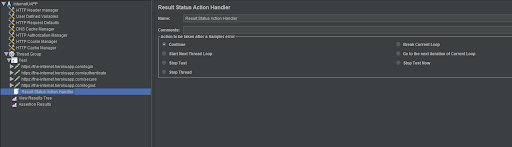
In the above snapshot, if you choose Stop Test Now. This will stop the test if there will be any error in the response.
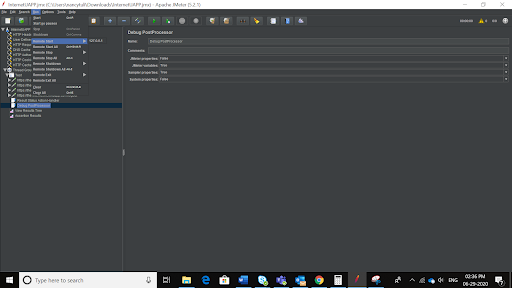
There is one more post-processor named debug processor which tracks the values of variables that are in the requests. 
Apache Jmeter tutorial 6
Jmeter Distributed (Remote) Testing
It is used to do testing on multiple systems. Applying all the load on a single server is not appropriate and can bring unexpected results. It is good to perform distributed testing with master-slave architecture.         There will be one master who will be driving various clients which will be again JMeter servers which will be putting load to the application under test. The firewall should be switched off in all the machines as it can block the traffic. All machines should share the sub-network and the JMeter version should be kept the same in all the machines to avoid any kind of complexities. 

Steps to setup master-slave architecture (Jmeter tutorial bonus)
1.       Go to the slave server and then go to the bin directory where JMeter is downloaded. You must then execute a file named JMeter-server.bat. Suppose the slave machine has IP address 120.178.0.9. 
2.       Now, go to the master machine and go to the bin directory. There, you have to edit JMeter.properties file. You must add the IP of the slave machine in front of remote_hosts. 
3.       Now for running the tests, you must go to the GUI of JMeter. Select the Run section on the menu bar of JMeter and then select a remote start and then the IP address of the slave machine. 
Apache Jmeter tutorial 5
Detailed Steps to Use JMeter for Performance & Load Testing (Jmeter tutorial exclusive)
1.       Start JMeter. 
2.       Add the BlazeMeter extension to the google chrome browser. Now hit the URL on the google chrome browser and record the flow with BlazeMeter. Once the steps have been captured then you can download the file from BlazeMeter in JMX extension. 
3.       You can then open the JMX file in your JMeter. It will appear as below. 
Apache Jmeter tutorial
4. Now, you must add a number of threads, ramp-up periods, and loop count. Number of Threads is the total number of users accessing the website. The number of times per thread will execute. Ramp-up period is the delay that should be applied before starting the next user. Suppose if you have 1000 users and a ramp period of 1000 seconds then delay between every user request will be 1000/1000 = 1 second.  

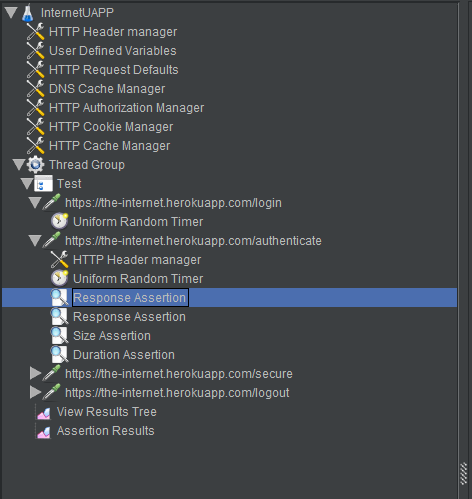
5. Now, add the listeners to view the graphical results. Let us add the most used listeners such as View Results and Assertions Results. 
Apache Jmeter tutorial
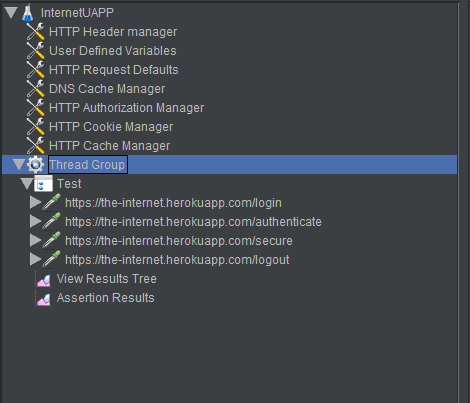
6. You can also name the requests in different transaction controllers such as login can go to login controller, authenticate, and secure to security controller and logout to sign off the controller. If you want to execute extensive tests, then these controllers will help you running many requests. 
7. Add Post-processor which would stop the tests in case you get any errors in the response. 
Apache Jmeter tutorial
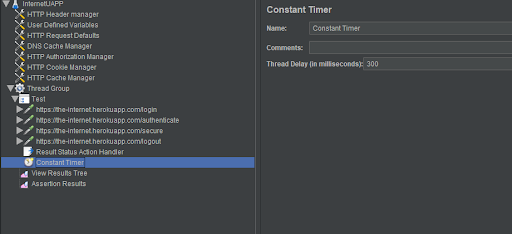
8. Add Constant timer with a time period of 300 ms between each user request.
Apache Jmeter tutorial
9. For each request, you can add assertions to validate that if the requests are giving proper response. Different Response assertions can be used to validate the status code as 200 and to validate the test in the output response. You can also add duration assertion to check if the requests are completed in a particular amount of time. Size assertion can be used to check the response in bytes. 
Apache Jmeter tutorial
10. Now, run the tests using the green run button on top. Now it’s time to analyze view results and assertion results. 
Apache Jmeter tutorial
You have to analyze the throughput and deviation. Throughput is the server’s ability to handle a number of requests per minute. The higher the throughput the higher is the capacity of the server to handle user requests. The deviation is the second parameter which is of utmost importance in this graph to be analyzed. It means the variation from the average. Throughput should be higher, and deviation should be least. These parameters, you will be getting from the client which you have to validate and send a report to the client with these graphs. 
Also, you must remember in this Jmeter tutorial,  is the Assertion report. 
You will see the different assertions been passed and failed in this tree so that you can know which ones are failing. 
One more important listener is the View Results Tree listener. You will be seeing which requests got passed and which ones got failed. The ones which are in green color are passed and the ones which are in red color are failed. 
The last important listener which you can add is the Summary report which will let you know total samples, average, Min, Max, Error %, Deviation, and Throughput. This report is of the utmost importance to stakeholders. Let us see how it looks. 
Conclusion for Jmeter Tutorial
That sums Use JMeter tutorial to use performance and load testing so that your application is robust and can sand load without giving unexpected results. Use the wonderful elements of JMeter to share excellent reports with the stakeholders. 
Hope you are satisfied with our Apache Jmeter tutorial. Please get back to us if you have any suggestions

AngularJS Testing Tutorial – Cypress, Karma and Protractor

AngularJS testing using selenium is not a good approach. Due to the asynchronous behavior of the application selenium is not able to handle the asynchronous calls.
So it is necessary to make use of angularJS testing tools so that asynchronous behavior of the application can be handled. Let us see some good approaches to test angular JS websites below.
Unit Testing AngularJS Apps
To make sure that unit testing is happening easily when it comes to AngularJS Testing, Angular JS has been provided with dependency injection for your XHR requests.  The main reason behind is to simulate requests.  The model can also be tested by altering the DOM directly.  in short, individual sort function can be tested in isolation.
ad angular js
What is Karma?
Karma is a JS runner created by the angular JS team themselves. and is one of the best when it comes to AngularJS Testing.
Jasmine is the framework for testing angular JS code while karma provides us with various methods which makes it easier to call Jasmine tests.
For installing karma, you need to install node JS in your machine. After installing node JS, install Karna using npm installer.
How to test AngularJS apps using Karma?
First of all,
One can install karma using below command
npm install karma –save-dev
After running this command, karma dependencies will be installed. It will be present in package.Json after you run the above command. For making karma available globally use -g option so that you can invoke it from anywhere.
Now, the next step is to install karma plugin which would help us in using the jasmine framework and google chrome browser. Run the below command:
npm install karma-jasmine karma-chrome-launcher –save-dev
After running this command, start making tests in command prompt. For creating tests, run the following command.
mkdir tests        // for making tests directory
touch tests/test1.controller.test.JS     //For creating a test called test1
After creating a test, now it is time to put code in test1.
describe(test1,function(){
beforeEach(module(test1));
var$controller;
beforeEach(inject(function(_$controller_){
$controller=_$controller_;
}));
describe(‘sub’,function(){
it(‘1 – 1 should equal 0’,function(){
var$scope={};
varcontroller=$controller(test1Controller,{$scope:$scope});
$scope.x=1;
$scope.y= 1;
$scope.sub();
expect($scope.z).toBe(0);
});
});
});
Now, after creating the test you should know how to create a test runner, and before creating that we should know the configuration required for the test runner. For configuring the test runner perform the following steps.
karma init karma.conf.JS
Now, for running the tests using the test runner run the following command.
karma start karma.conf.JS
The test output should look like the underlying code.
> @ test /Users/devuser/repos/test1
> ./node_modules/karma/bin/karma start karma.conf.JS
INFO [karma]: Karma server started at http://localhost:8080/
INFO [launcher]: Starting browser Chrome
INFO [Chrome 80]: Connected on socket 2absOkNfa1asasaX0fCJ with id 66276373
Chrome 80 test1 encountered a declaration exception FAILED
ReferenceError: module is not defined
at Suite.<anonymous>(/Users/devuser/repos/repo1/tests/test1.controller.test.JS:3:13)
at /Users/devuser/repos/repo1/tests/test1.controller.test.JS:1:1
Chrome 80): Executed 1 of 1 (1 FAILED) ERROR (0.01 secs / 0.005 secs)
Now, add the following lines to your package.JSon.
{
“scripts”:{
“test”:”karma start karma.conf.JS”
},
Now with the help of this script, we will be able to run any test using npm command. Using the below command, run the jasmine tests.
npmtest
Now, it is time to add the controller logic and for adding it run the following commands.
mkdir app
touch app/test1.controller.JS
Add the following code in test1.controller.JS
angular.module(test1,[]).controller(‘testController’,functiontestController($scope){
$scope.sub=function(){
$scope.z=$scope.x-$scope.y;
};
});f
For adding the angular dependencies, run the following commands. Make a directory called lib in your project and then add all libraries in that folder.
mkdir lib
curl -o lib/angular.min.JShttps://code.angularJS.org/1.4.0-rc.2/angular.min.JS
curl -o lib/angular-mocks.JShttps://code.angularJS.org/1.4.0-rc.2/angular-mocks.JS
Now, it is time to edit the karma config file so that it comes to know about the test folder and the library folder so that jasmine tests can run successfully.
files:[
‘lib/angular.min.JS’,
‘lib/angular-mocks.JS’,
‘app/*.JS’,
‘tests/*.JS’
],
Now, run the tests using the npm test. Your test will run now successfully.
How to test AngularJS applications using Protractor?
Protractor work flow
Protractor is impeccable when it comes to AngularJS Testing. In Angular JS applications are hard to test since the application web elements cannot be captured very easily.
Angular JS applications have some extra attributes like ng-repeater, ng-controller, and ng-model which can be identified using Selenium locators. Protractor is a NodeJS program which is written in JavaScript. The pre-requisite of using Protractor is Selenium and NPM.
Let us see how you can proceed with the installation of Protractor. Run the following command to start with the installation of the protractor.
npm install –g protractor
It will install protractor in your system. Using  -g will make it available globally in your system. Now, after installation of protractor If you want to check the version of the protractor. You can find the following by running the following command.

Protractor –version
For running the protractor tests against the application under test, you would need webDriver manager. Now, you must update the webDriver manager to the latest version. For updating it, run the following command.
webdriver-manager update
Now you must be imagining how would you start the webdriver-manager. You can start it by running in the background by running the following command. It will then listen to all your protractor tests which have to be run against the angular JS application.
webdriver-manager start
Now to see if the webdriver manager plugin if it is properly running or not. Go to the URL: http://localhost:4444/wd/hub/static/resource/hub.htmland you will see the webdriver manager plugin running on it.
Now, we will see how to design the test cases in protractor. To start with designing o the test cases you need 2 files. One is the spec file and the other is the config file. The configuration file has the location for the protractor tests. Also remember, chrome is the default browser for a protractor. While the second file, the spec file has the logics and locators which would be used to interact with the application.
Now, let’s take a test case in which we have to go to URL: https://angularJS.org, and then you have to type your name in the textbox. After entering you will see your name as Hello Name!
Now, let us start with the steps which are required for making this test case and to execute it. In your folder, you will have 2 files. One is spec.JS and the other is conf.JS. The logic for spec.JS which will be there in it.
describe(‘Enter yourname, function() {it(‘should add a Name as your name, function() {browser.get(‘https://angularJS.org’); element(by.model(‘yourName’)).sendKeys(‘Name’);  var name= element(by.xpath(‘html/body/div[2]/div[1]/div[2]/div[2]/div/h1’));expect(name.getText()).toEqual(‘Hello Name!’);  });});
Now, if you see that describe comes from the Jasmine framework. It is basically a module and it can be a class or a function. We are giving this module name as “Enter Your Name”. So, for starting the function we start it with describe keyword. Just like a class can have many methods or a TestNG class can have so many test cases. Similarly, in the Jasmine framework, it starts a new test case.
browser.get(‘https://angularJS.org’);
This command is used for opening the browser with URL mentioned as https://angularJS.org. Now, you must identify the elements. So, you have to inspect the element just like you do in Selenium. You can use By.model for the elements who have ng-model as an attribute.
You can store Web elements in a variable. You can declare a variable using var keyword. Now, it is time to have some assertions. You get the text out of this web element and then compare it to the expected text.
Now, you are done with spec.JS and let us start with the conf.JS. You have to define the path of spec here so that tests can be identified easily.
Paste the following code in conf.JS
exports.config = {seleniumAddress: ‘http://localhost:4444/wd/hub’,  specs: [‘spec.JS’]};
Selenium address is the location where it can communicate with the selenium webdriver. Spcs tell the location of spec.JS
Now, for running the test, first navigate to the directory in which spec.JS and conf.JS are located. First thing to keep in mind that webdriver-manager should be started. If not started, you have to first start it with following command.
webdriver-manager start
Now, it’s time to run the configuration file. After starting the webdriver-manager plugin, run the config.JS file using protractor. Fire the following command.
protractor conf.JS
You have seen how many specs got passed and how many got failed.
Now let’s see how the failure is going to be reflected in the console. We make the assertion false.
Modify the code in spec.JS
describe(‘Enter your name, function() {it(‘should add a Name as your name, function() {browser.get(‘https://angularJS.org’); element(by.model(‘yourName’)).sendKeys(‘Name’);  var name= element(by.xpath(‘html/body/div[2]/div[1]/div[2]/div[2]/div/h1’));expect(name.getText()).toEqual(‘Hello!’);  });});
You will see F which means failed test case. You will get to know the complete description where the test case got failed.
Now, you must be imagining how would the reports be integrated with Jasmine. Let’s install the Jasmine reporter. Run the following command:
npm install –save-dev jasmine-reporters@^2.0.0      
If you want jasmine reporter to installed globally. For installing globally, run the following command.
npm install –g jasmine-reporters@^2.0.0
You have to now modify the conf.JS. You have to add Jasmine reporter in it. Add the following code in it.
exports.config = {seleniumAddress: ‘http://localhost:4444/wd/hub’,      capabilities: {          ‘browserName’: ‘Chrome’      },      specs: [‘spec.JS’],     framework: ‘jasmine2’ ,onPrepare: function() {          var jasmineReporters = require(‘C:/Users/User1/node_modules/jasmine-reporters’);jasmine.getEnv().addReporter(new jasmineReporters.JUnitXmlReporter(null, true, true)          );     }   };
Now, run the tests using protractor conf.JS. You will see the junitresult.xml in the folder path given in conf.JS.
Open the XML file and see the result of the test case. In this way, you can take the help of protractor to test angular JS websites.
How to test the AngularJS app using Cypress?
Cypress is very close to the application. It just has a very thin layer between production code and testing code. It is Javascript E2E testing framework.
It is an open-source AngularJS Testing framework Cypress has bundled various packages such as Mocha, Chai, and Sinon. The only supportive language with Cypress is Javascript. When you open the cypress application using command cypress open, the following application will open.
This application is divided into two parts. On the left side, you write commands. There are different keywords to it. VISIT is for opening the URL and GET is for getting a webelement. CLICK is for clicking on the webelement. Using ASSERT, we can add assertions to our test cases.
For installing Cypress, you should have node.JS installed in your machine. You can then use the npm installer to add dependencies of Cypress.
npmicypress -D
Now for opening the cypress test runner, run the following command.
npx cypress open
If you want your application and Cypress to run at the same time then you have to make some changes in your package.JSon.
“cypress”: “concurrently \”ng serve\” \”cypress open\””
Add these lines in package.JSon.
Now, run the following command
npm run cypress
When you add a new project in cypress then you will have below folder structure.
Fixtures have static data that has to be used by your tests. You can use them by cy.fixture() command.  In the integration folder, you will have your integration tests. The plugin helps you to tweak to your test cases. Just like plugins have a file named index.JS which have a method which will run before every spec file. In Support files, you can have your reusable code.
Now, it is time to create your first test in the integration folder. You name it as test1.spec.JS. You will see it in the Cypress test runner also. Cypress API is present under the global cy project. Now let us put some code in it.
describe(“Test1”, () => {
it(“should visit home page”, () => {
cy.visit(“http://localhost:4200/login”);
});
});
It makes use of description and it blocks from the mocha syntax. It makes the beginning of the test cases. Once you will run this test In the test explorer, on the right side, the execution starts.
When you will run Cypress for the first time, you will see that the cypress.JSon file will get generated. In this, you can store your configuration values. Now let’s store our base URL in cypress. JSON so that we don’t have to change the URL in every test case.
{
“baseUrl”:”http://localhost:4200″
}
It’s time to change the code in spec.JS also.
describe(“Test1”,()=>{
it(“shouldvisit home page”,()=>{
cy.visit(“/login”);
});
});
Now for getting webelement, you can make use of a cypress selector background in the test runner. It is present on the left side of the test runner. You can get the XPath from there.
Use this way to get the webelements.
cy.get(‘.btn-link’).click();
cy.url().should(‘include’, ‘/register’)
This assertion will check the check has registered keywords in it. Hence, we are done with the first test case in cypress.

Conclusion
Now, we have seen different ways of AngularJS Testing. Make use o
f these and test the application in the best possible ways. Optimize your code and have the best test integration practices so that the client can be satisfied with your test metrics. All the best.

How to Automate Mobile Application Testing Using Selenium

Selenium is an open-source testing tool that is primarily used for regression testing and functional testing. Identified as a collection of software testing tools, the Selenium suite can be used to automate web browser testing. Speaking of mobile application testing, it is a well-known fact that you as a tester must have heard about Selenium. And if you are curious to know whether Selenium can be used to automate mobile application testing, the following detailed explanation will throw light on your queries.
app testing
To answer the question “Can Selenium be a mobile application testing tool?” the answer is negative. But the good news is that you can make the most of the Selenium to test mobile websites. This is definitely a reason that can cheer you up. And there are a couple of another reasons that will make you smile.
Selenium, as an open-source testing tool, does not involve any licensing cost and hence ranks above over other testing tools that are currently employed. While you cannot use Selenium to automate mobile application testing, you are at an advantage to employ the frameworks of Selenium that are exclusively designed for mobile automated testing.
Selenium Frameworks Designed for Automating Mobile Application Testing

  1. Selendroid
  2. Appium

Selendroid:
In line with this very name, Selendroid is a Selenium framework that can be employed to test the user interface of native and hybrid applications that can be run on the Android platform. It is also important to note that while the Selendroid framework is suitable for emulators, it also can find its place in the Selenium Grid, when the framework can be integrated with real devices. Essentially meant to perform parallel testing and scaling, the Selendroid framework allows you to simultaneously communicate with multiple Android devices.
Selenium Appium: 
Selenium Appium is an automated, open source test framework that can be employed to test mobile user interfaces that come with native, hybrid and mobile web applications. It is also a cross-platform tool that can is compatible with many languages including Node.JS, PHP, Java, Objective-C, JavaScript, Clojure, C#, Python and Perl. You as a tester can make the most of its cross-platform characteristic when you can effortlessly employ Selenium Appium through a single test script to perform tests on Android, Windows, Mac, Linux or iOS platforms.
A Dozen Simple Steps Involved in Automating Mobile Application Testing Using Selenium Appium
1. Your first step is to visit http://appium.io. You then need to download the Appium framework along with sample files as demonstrated under:
appium-mobile-app-automation-screenshot
2. The next step is to unzip the downloaded files.
3. Proceed further by downloading and setting up Android-SDK file on to your computer.
4. Check out the Android-SDK framework and identify the AVD Manager application. This is to create a “Default”            Android Virtual Device.
5. The next step is to run Eclipse.
6. You then need to access the unzipped folder to import the Java->JUnit sample code according to the following              illustration.
import-screenshot
 
appium-master-screenshot
 
7. After the previous step, this is what you will get to see; the imported Java project structure.
src-screenshot
8. You are now all set to execute the Appium.exe file which is saved in the unzipped folder, as demonstrated below.
appium-desktop-screenshot
9. You can now launch the Appium server window that will show up as under.
appium-server-window-screenshot
10. Without any hassles, you can change the AndroidContactsTest.java file according to your requirements.
11. You can now run the Java class as JUnitTest as depicted below.
package-explorer-screenshot
12. Your outcome will be that the application has passed the test.
Voila! These simple steps when performed in series will grant you the power of Selenium Appium to automate mobile application testing.

Top 5 Automation Testing Tools for Android

Automation testing is used these days in almost all the test processes. The advantage of a reduced testing time along with reduction in error has led to its widespread acceptance among software testers. With a wide variety of testing tools available for this purpose, one should be aware of their features to better understand them.
automation testing
Choosing a single tool to support you entire project is rather impossible, since most tools may not be able to fully correspond to you project. Here we discuss the top 5 tools that have been the most sought after by Android testers around the globe.
1.Robotium Android Testing Tool
Pros
It is one of the first and frequently used automation tools for Android software testing. Robotium, a free Android UI testing tool is suitable for test automation of different Android versions. Often referred to as Selenium by Android Software developers, the tests created by Robotium are written in Java. Robotium is also a library for unit tests.
Cons
But Robotium is time consuming and needs much more effort to create tests in it. This is because in order to automate tests, one must work with the program source code. Also the tool is unsuitable for interacting with system software; it is incapable of locking and unlocking smart phones or tablets. Robotium does not have a record or a play function and it also does not provide screenshots. As part of continuous integration, Robotium incorporates easily with Maven, Gradle or Ant for the execution of tests.
2.MonkeyRunner
Pros
This is a popular Android app testing tool used for the automation of functional tests for Android software. This tool is more low-level when compared to Robotium, but does not have to work with the source code in order to automate tests. Written in Python, it also gives provision of using a recording tool for creating tests.
With MonkeyRunner, it is possible to run tests on real devices connected to a PC or emulators. The API within the tool helps to control a smart phone, a tablet or an emulator from outside of the Android code.
Cons
The biggest disadvantage of this mobile app testing tool is the necessity of writing scripts for each device. Another drawback is the need for a test to be adjusted each time the user interface of a test program changes.
3.Appium Android Automation Framework
Pros
Appium is used to test iOS and Android native mobile web and hybrid applications. While native apps are written with the help of iOS or Android SDKs, mobile web apps can be opened on mobile browsers and hybrid apps are totally involved with “webview”. It is an open-source mobile automation tool.
The running of tests does not require any changes to be made in the source code which is a huge advantage. The Selenium JSON Wire Protocol used in Appium allows you to write the test in any language supported by Selenium. Appium facilitates testers to reuse the code between iOS and Android test suites even though it is considered a “cross-platform” tool.
Cons
The advantages are in plenty, but it would be a sin not to discuss its drawbacks as well. It takes a long time to configure appium for both android and iOS and also is prone to too many unexpected errors.
4.UI Automator
Pros
UI Automator allows you to do more in Android app testing and games when compared to the basic framework that is Robotium. You can test the user interface (UI) of your native Android apps on one or more devices with Google’s test framework. Another advantage of UI Automator is that the cases can span across different processes with JUnit test cases having special privileges. It also provides five different classes for developers.
app testing
Cons
UI Automator has its downsides, one of them being it only works on Android devices with API level of 16 or higher. Another drawback of UI Automator is its lack of support for webview, were directly accessing Android objects is not possible.
5.Espresso
Pros
It is the latest Android test automation framework open-sourced by Google. It is available for developers and software testers to work on their UIs. Its API is small and predictable making it easy to learn and above all built on top of the Android instrumentation framework.
It helps to write concise and reliable Android UI tests and is supported on API level 8 (Froyo), 10 (Gingerbread), and 15 (Ice Cream Sandwich) till current versions.
Its reliability and the ability to synchronize with the UI thread makes it fast since there is no need for any sleeps.
Cons
Just like UI Automator, it too suffers the drawback of not supporting webviews.